Unique Data,
Interactive Visualizations
Are you looking for custom, interactive data visualizations that turn complex data into engaging web experiences?
As a freelance developer, I partner with agencies and organizations to craft unique charts that tell stories and make an impact.
Trusted by agencies and organizations including


Featured projects
Custom charts in action
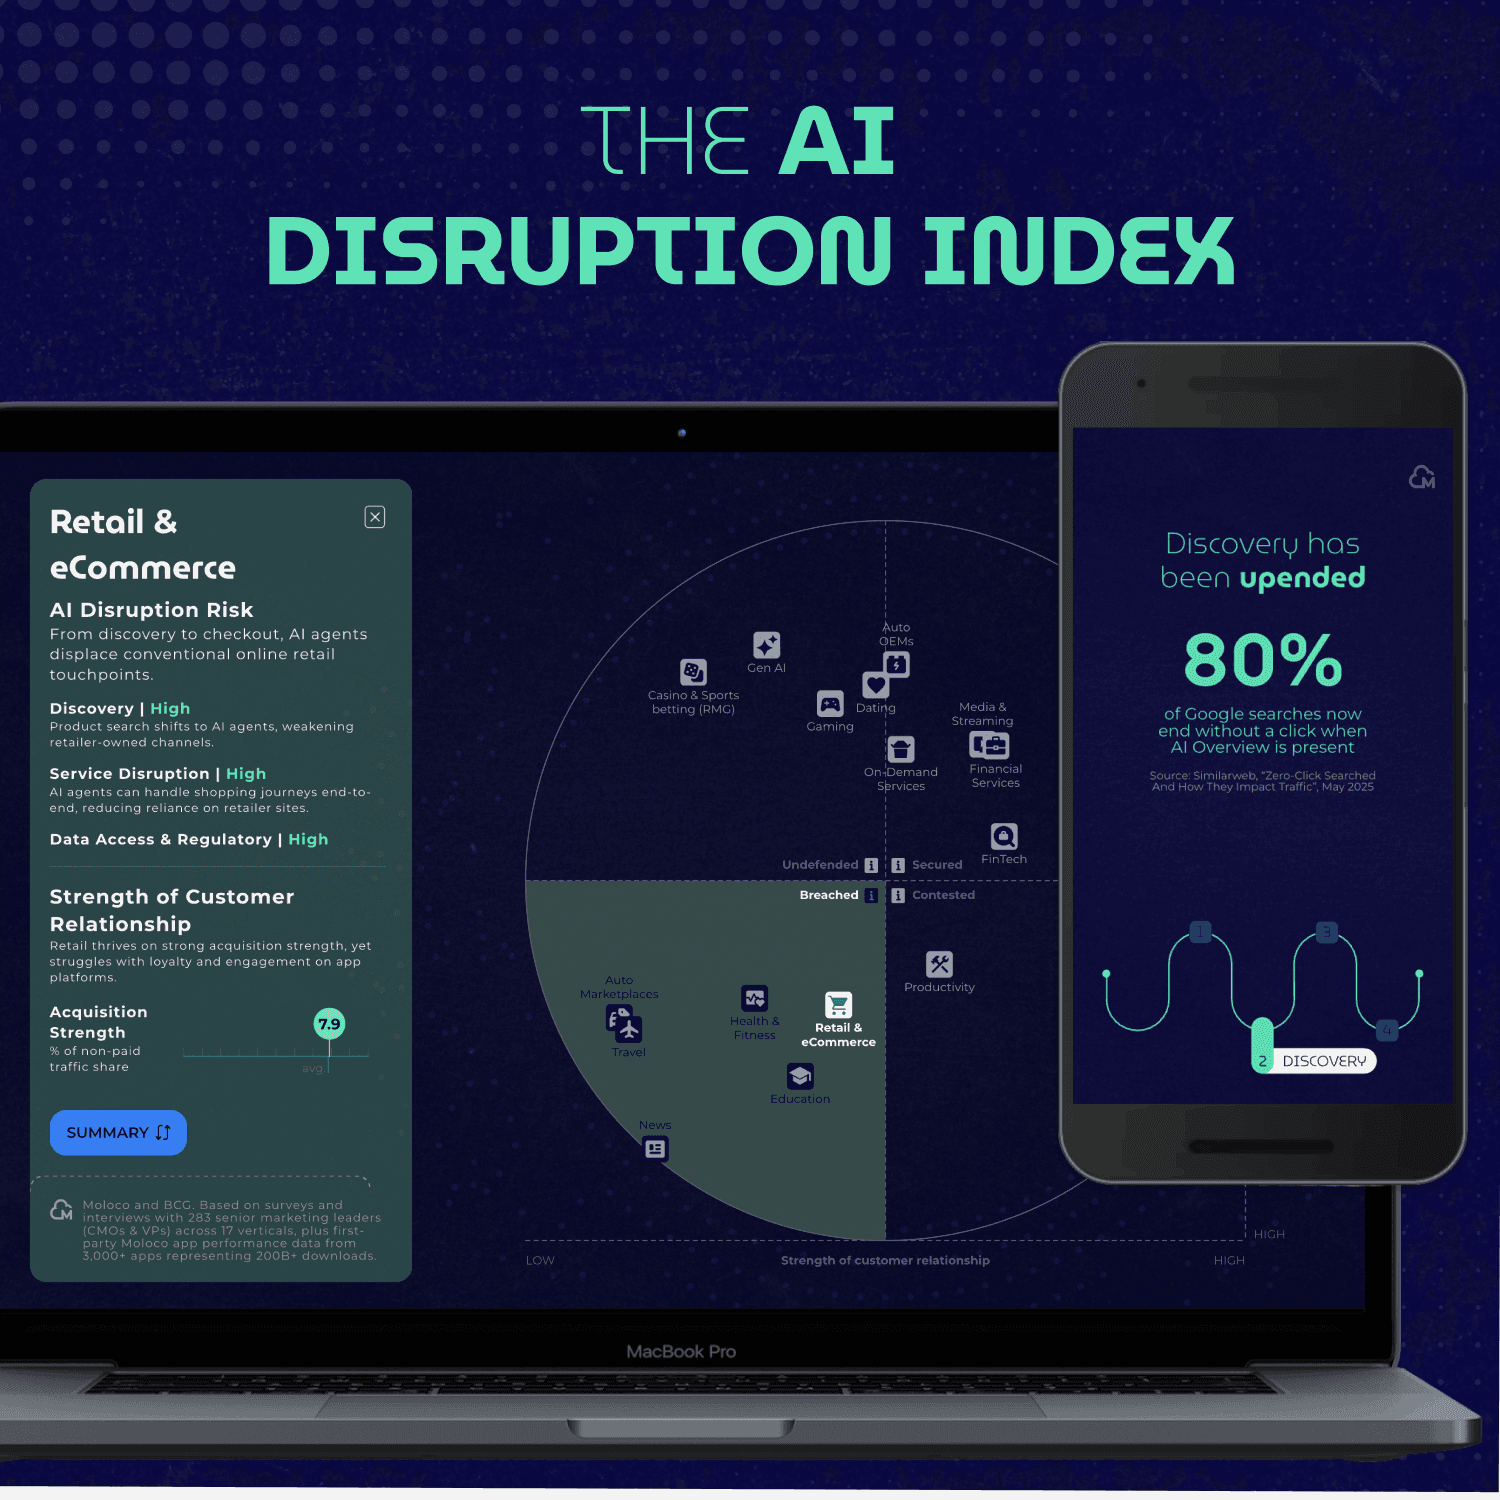
Scrollytelling Report: "AI Disruption Index"
.png&w=1920&q=75)
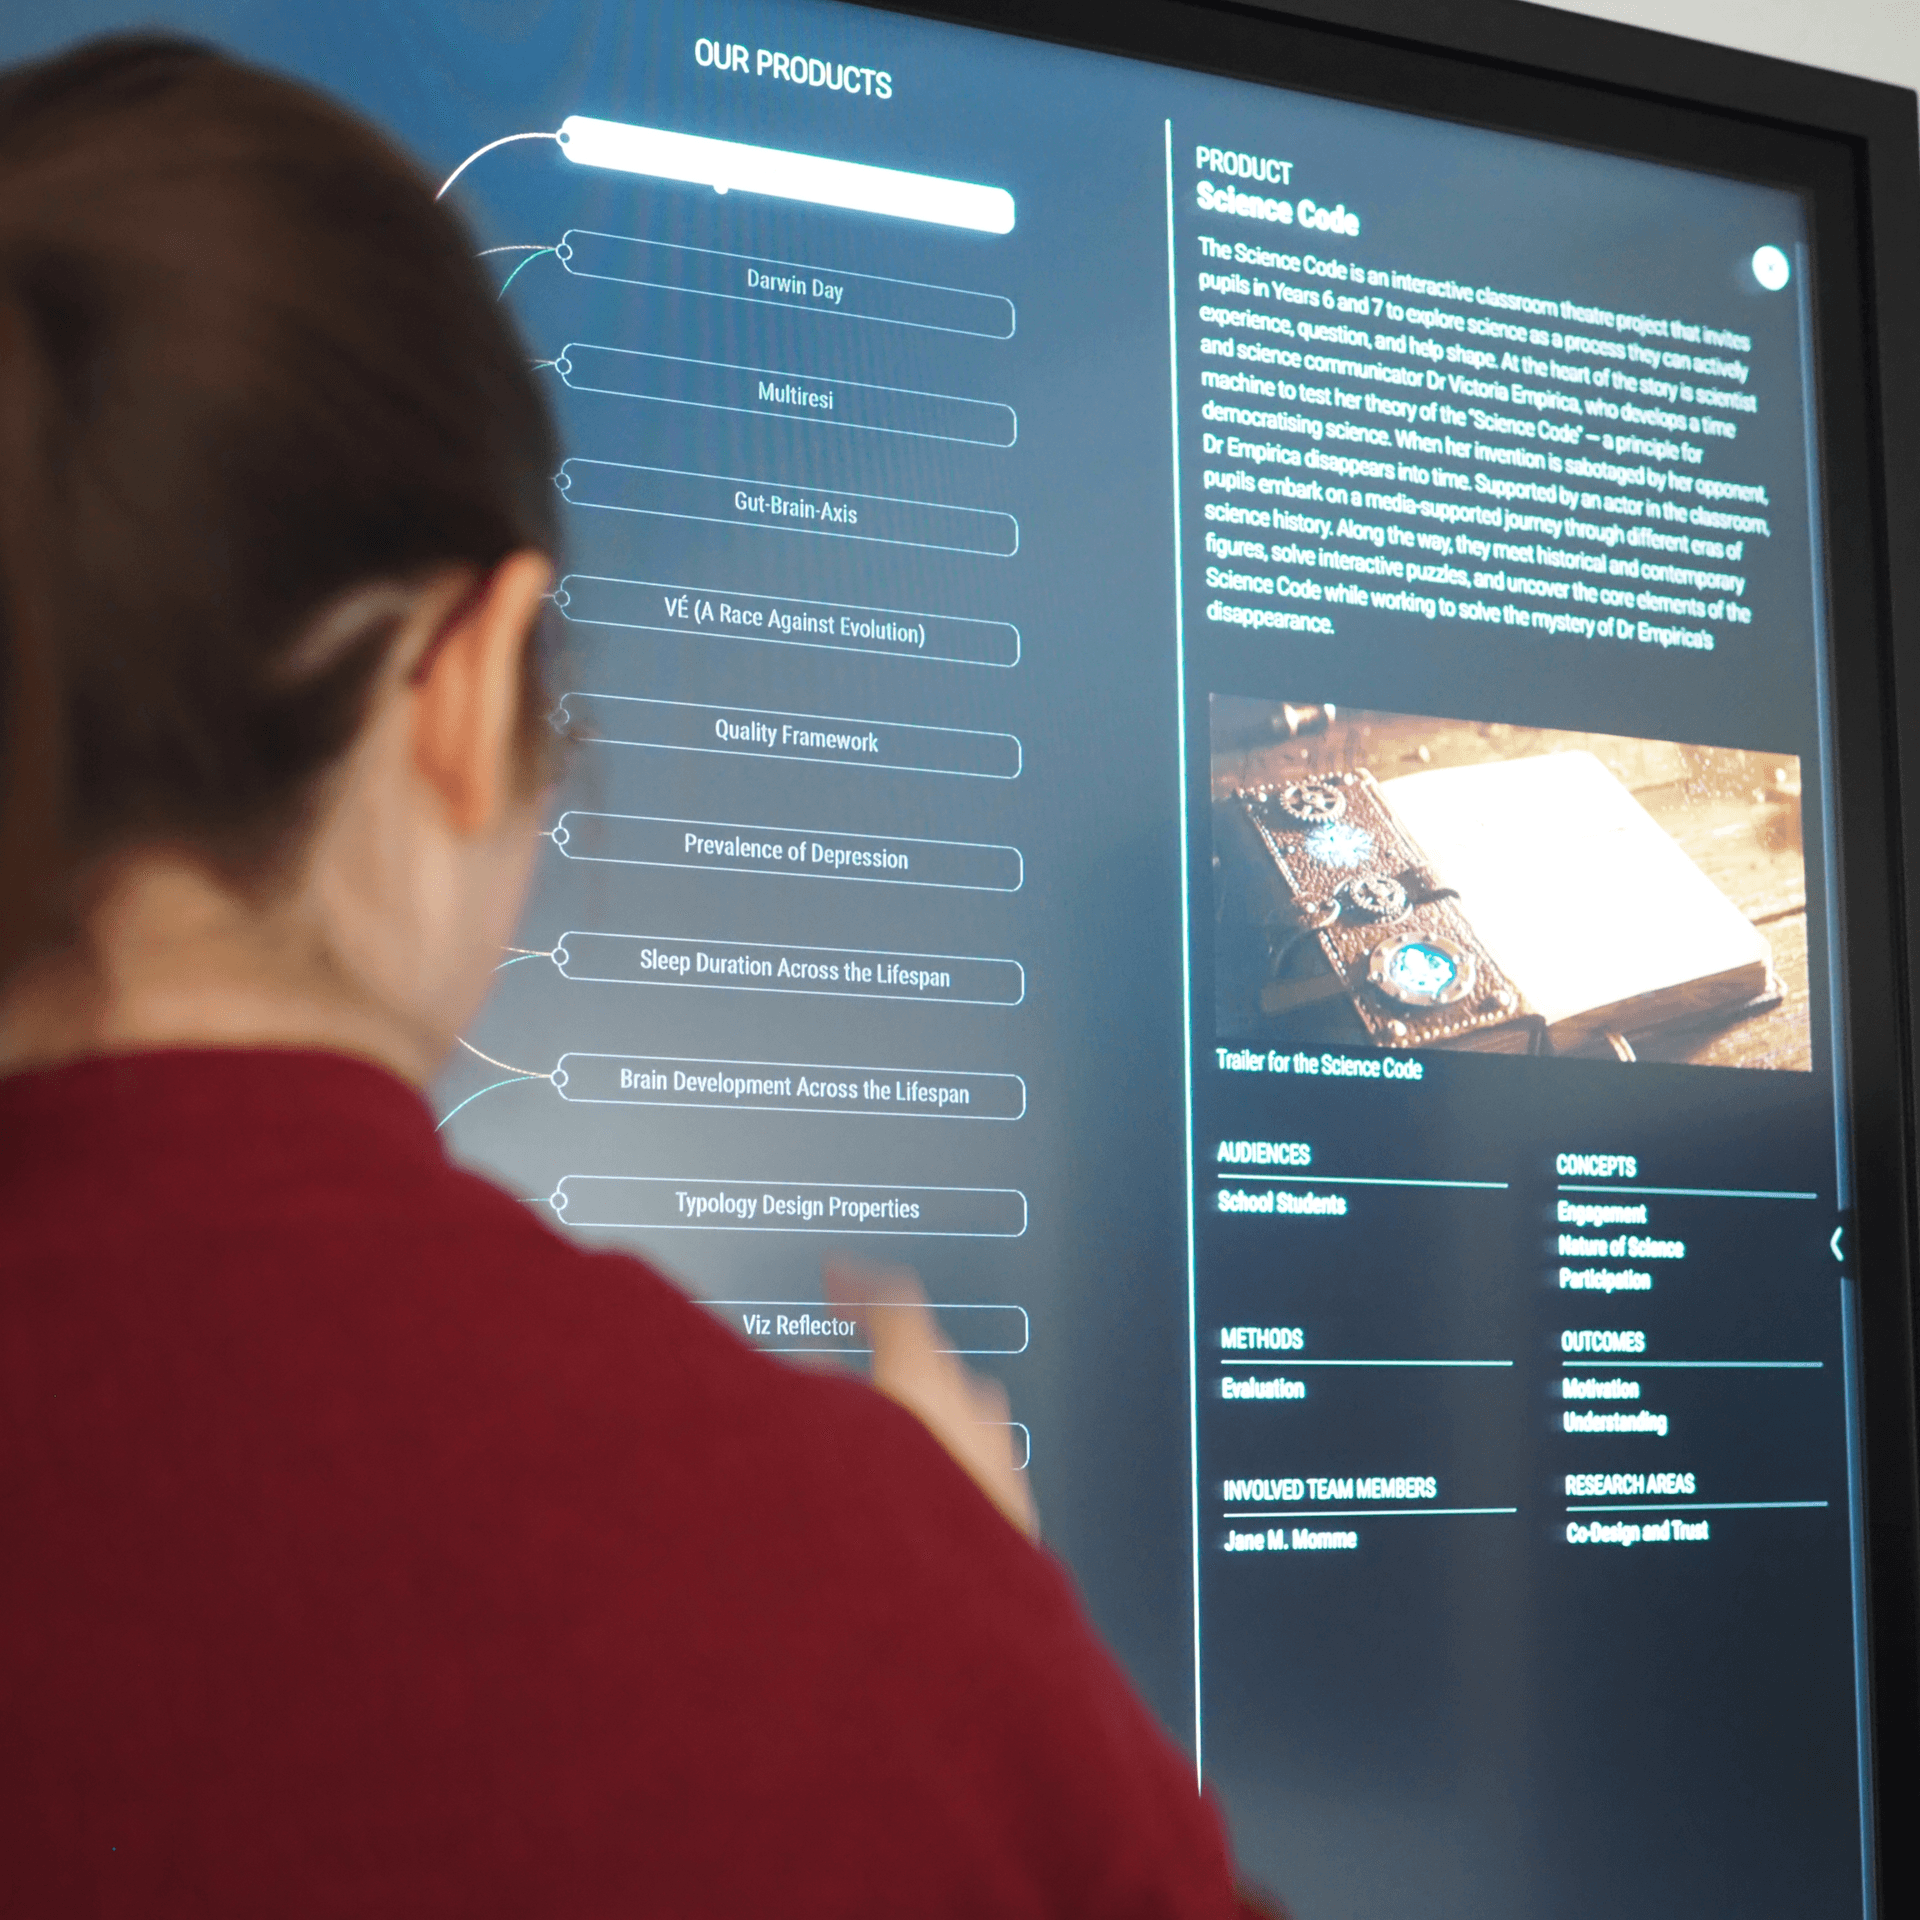
Visualizing an Interdisciplinary Research Agenda
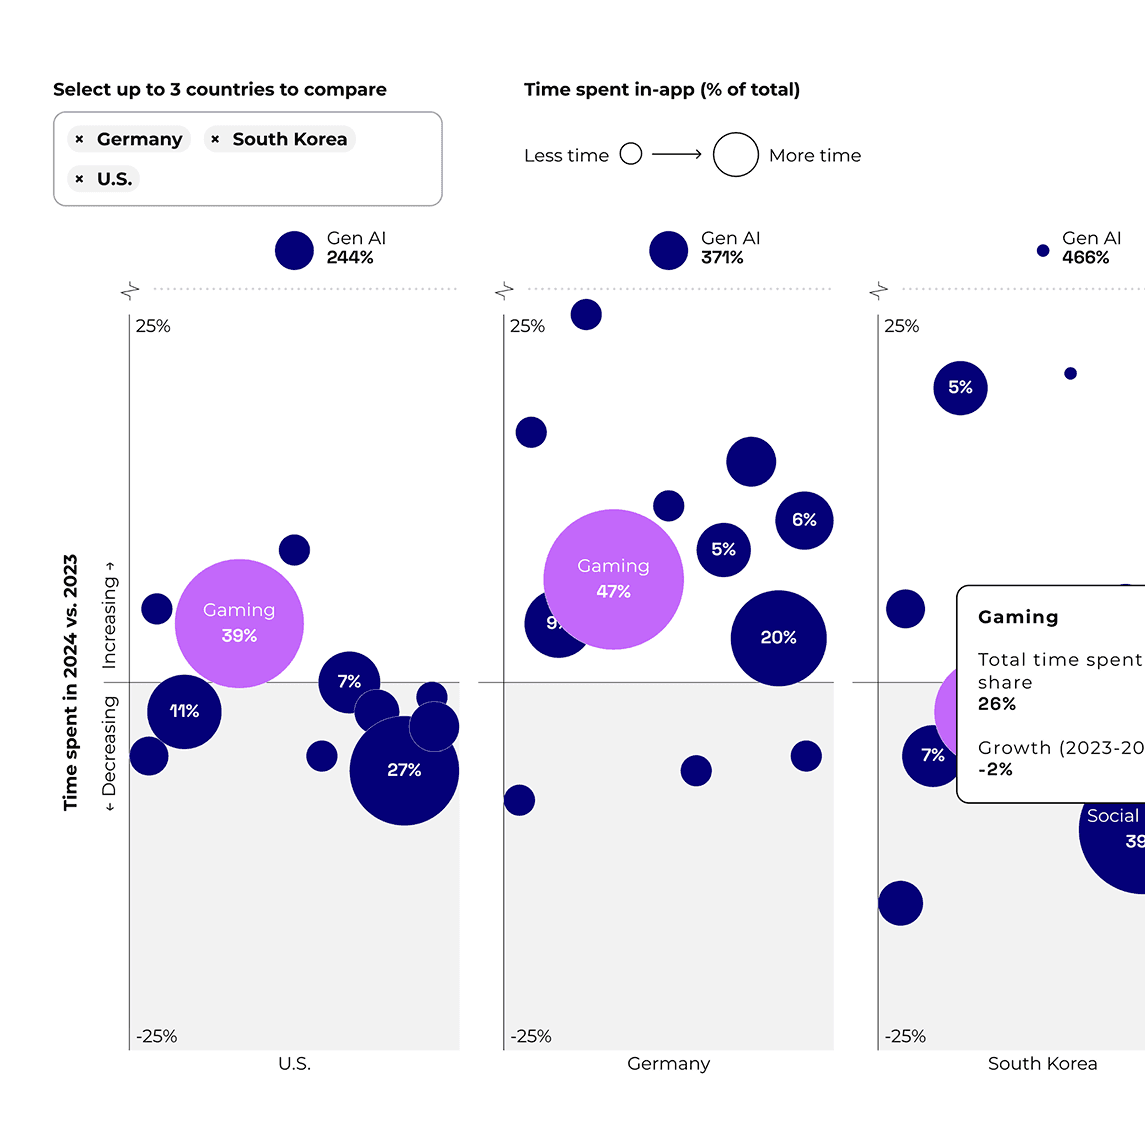
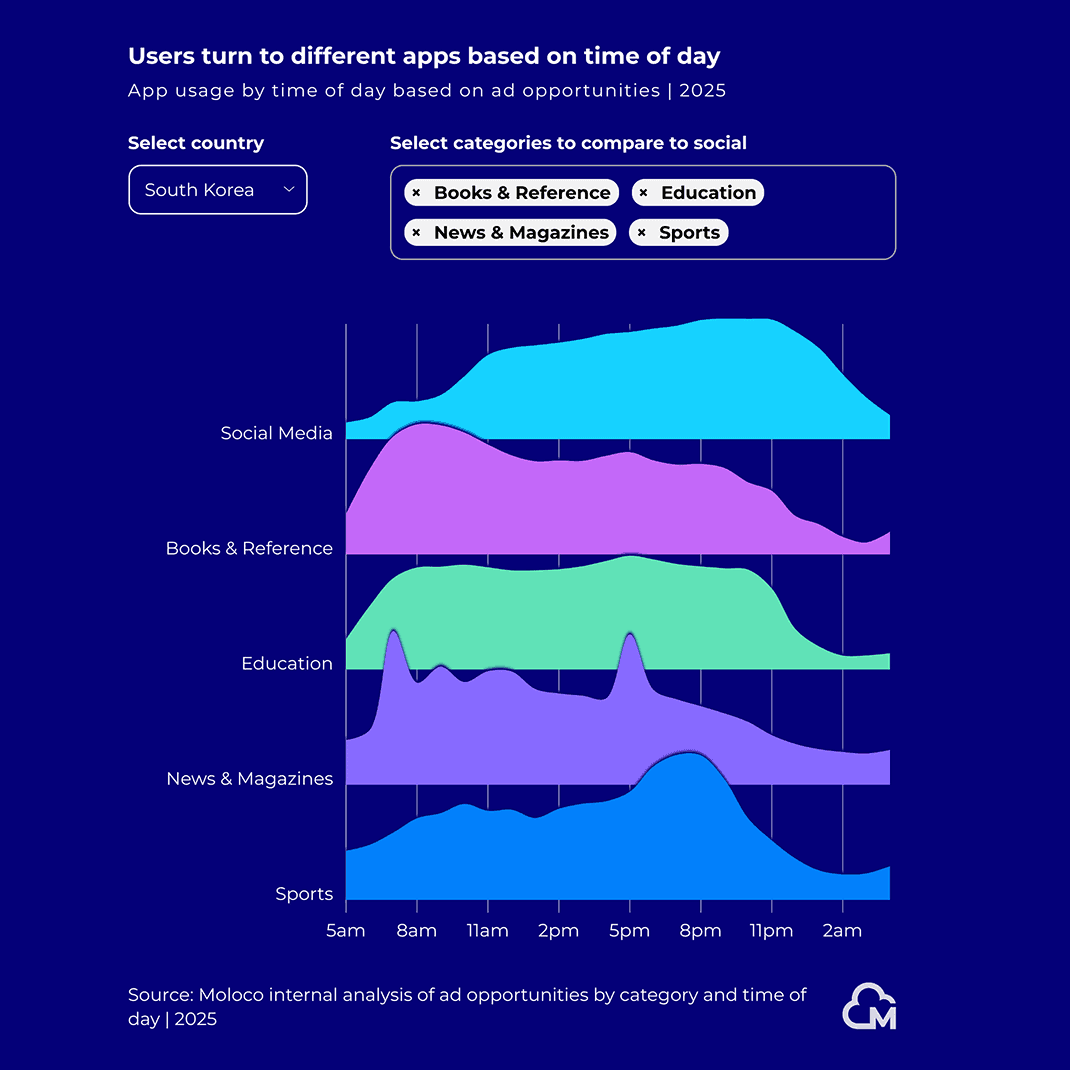
Interactive Visualizations for a Mobile Marketing Industry Report
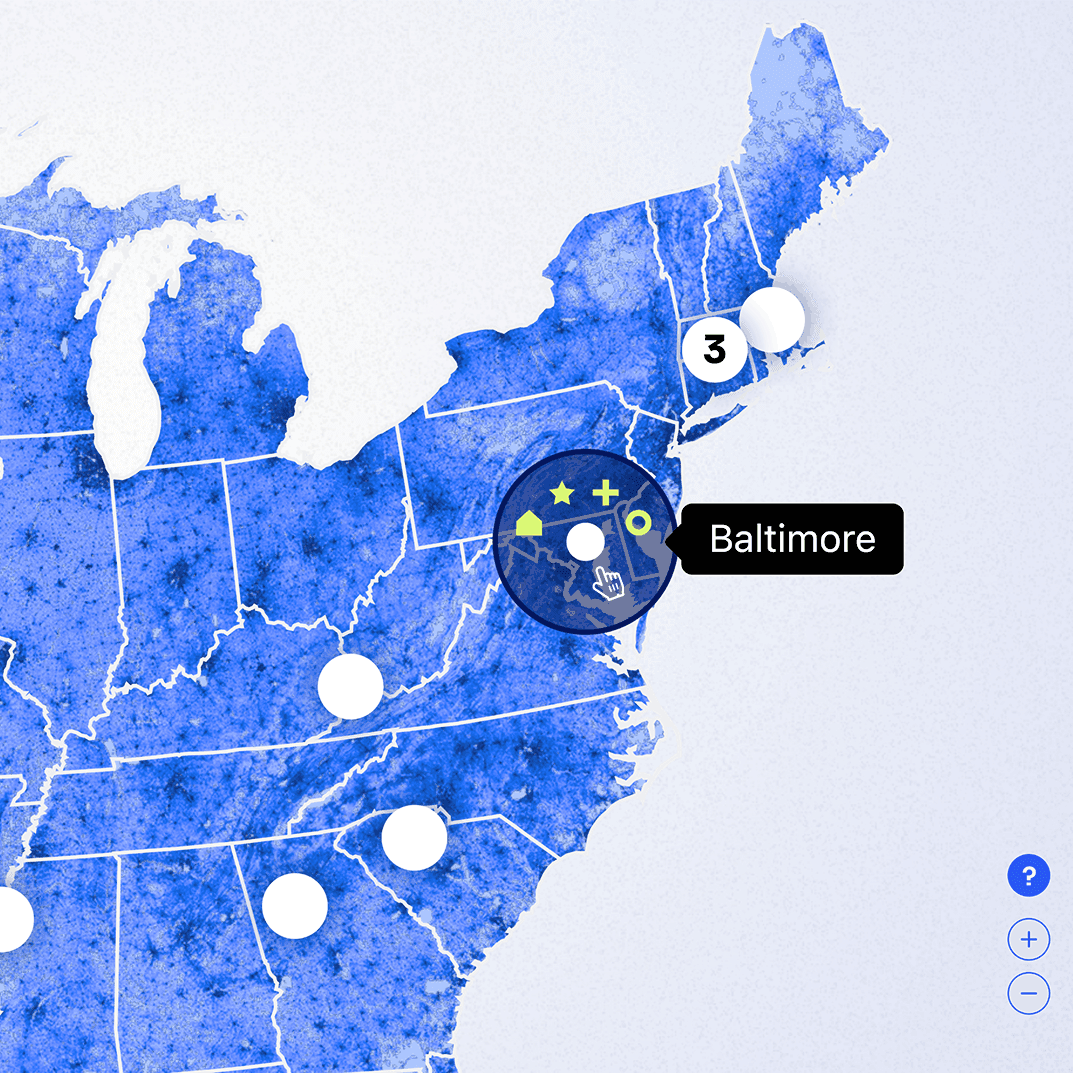
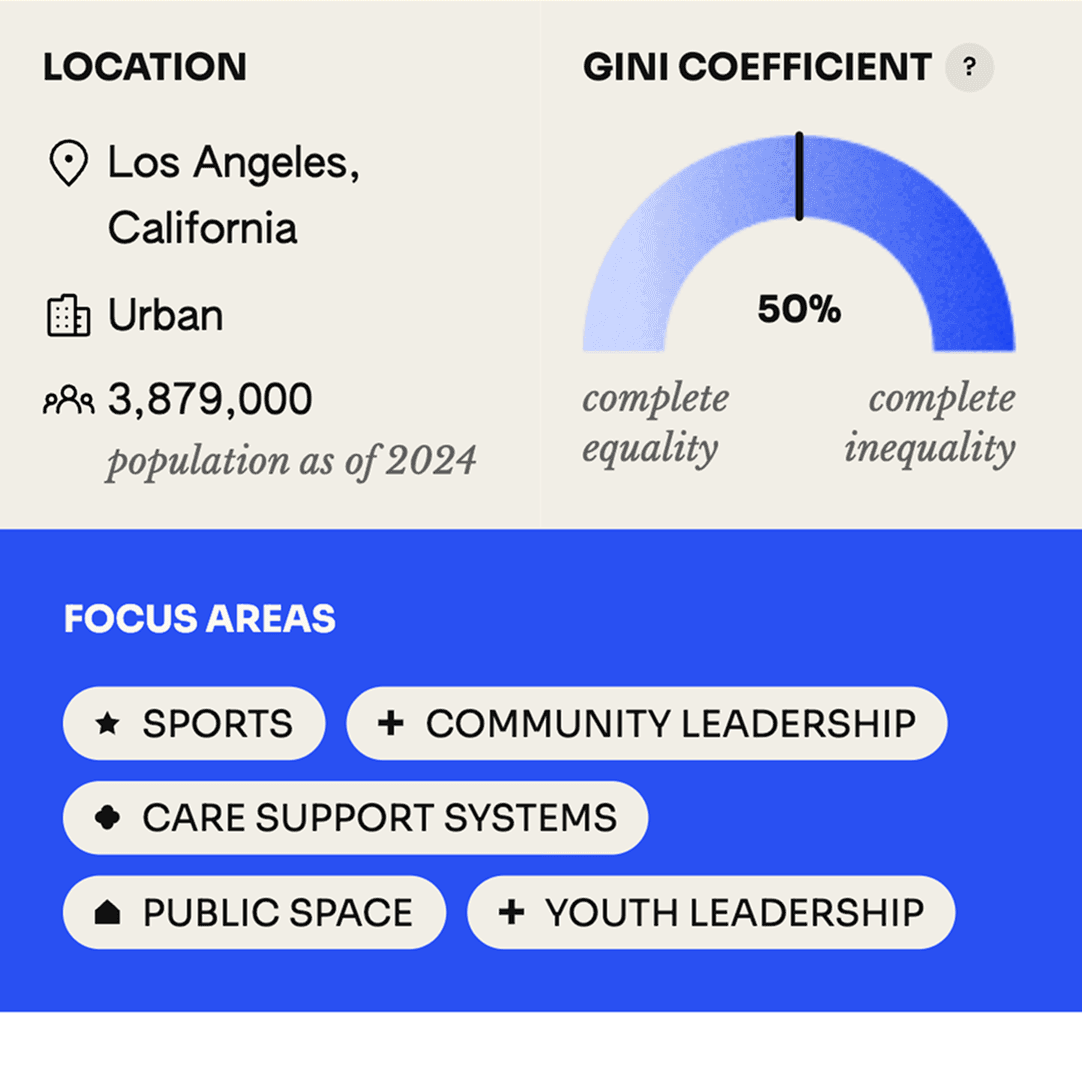
Visualizing Place-Based Impact Across the U.S.
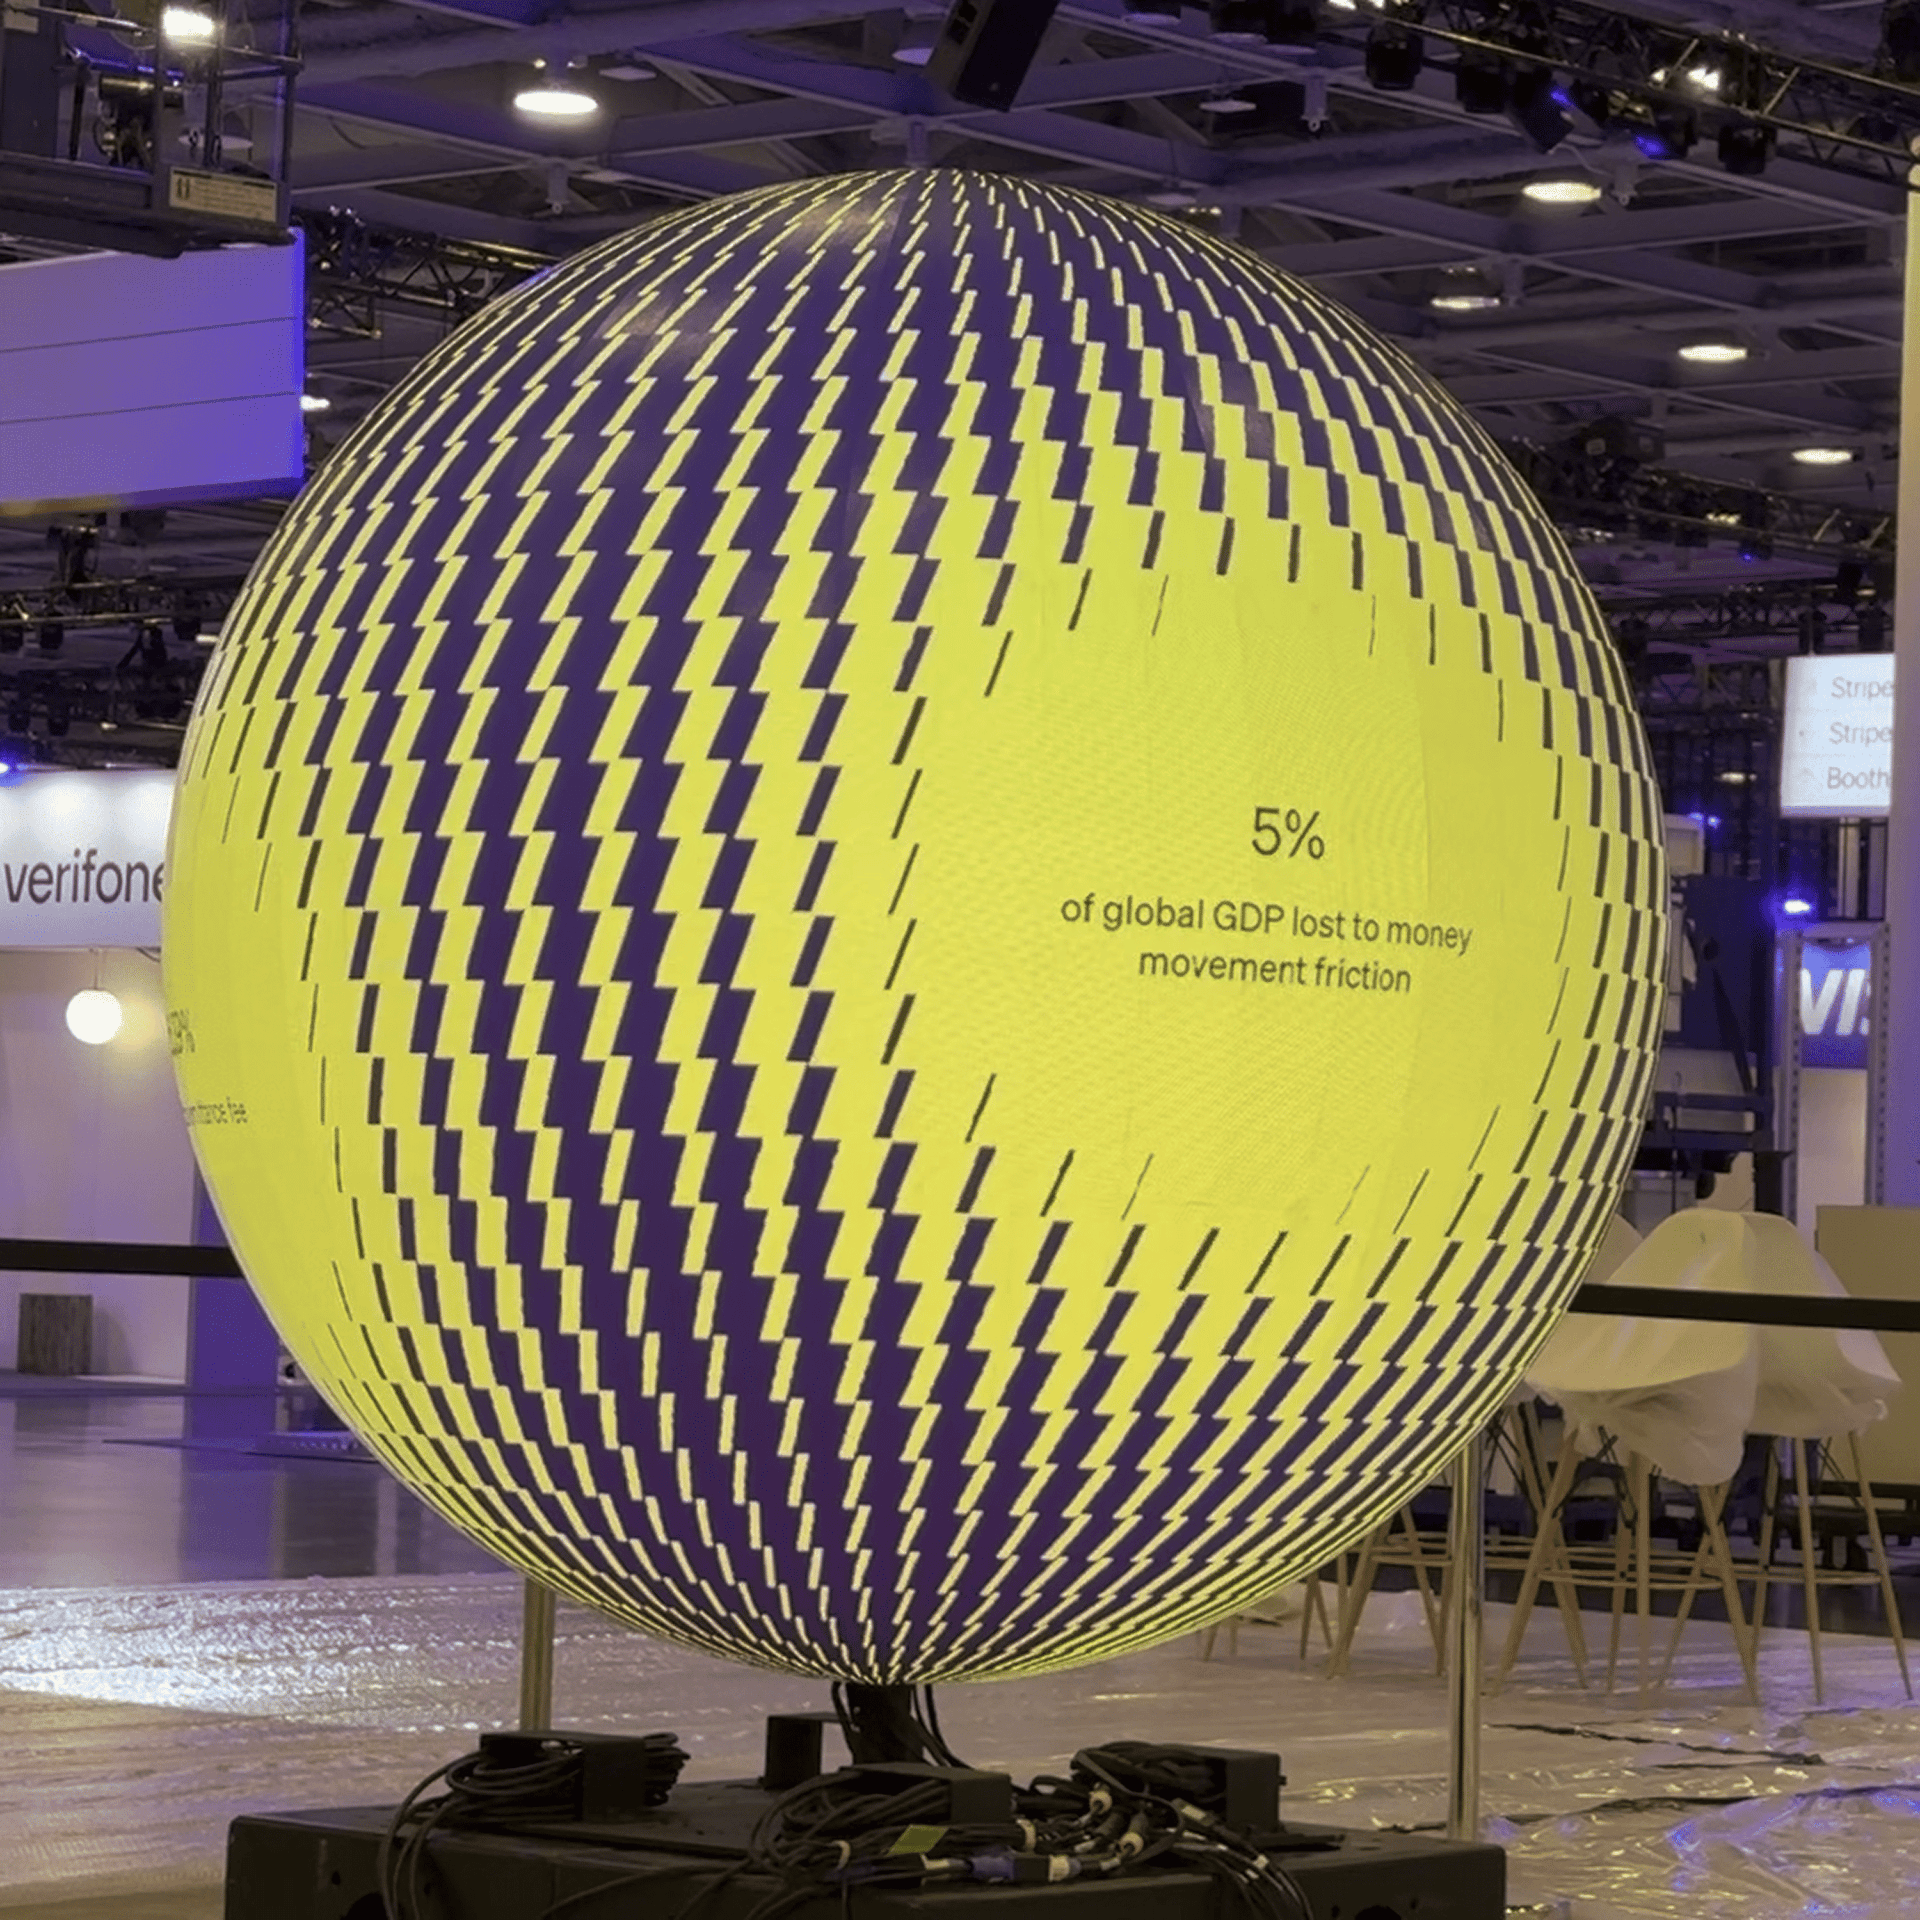
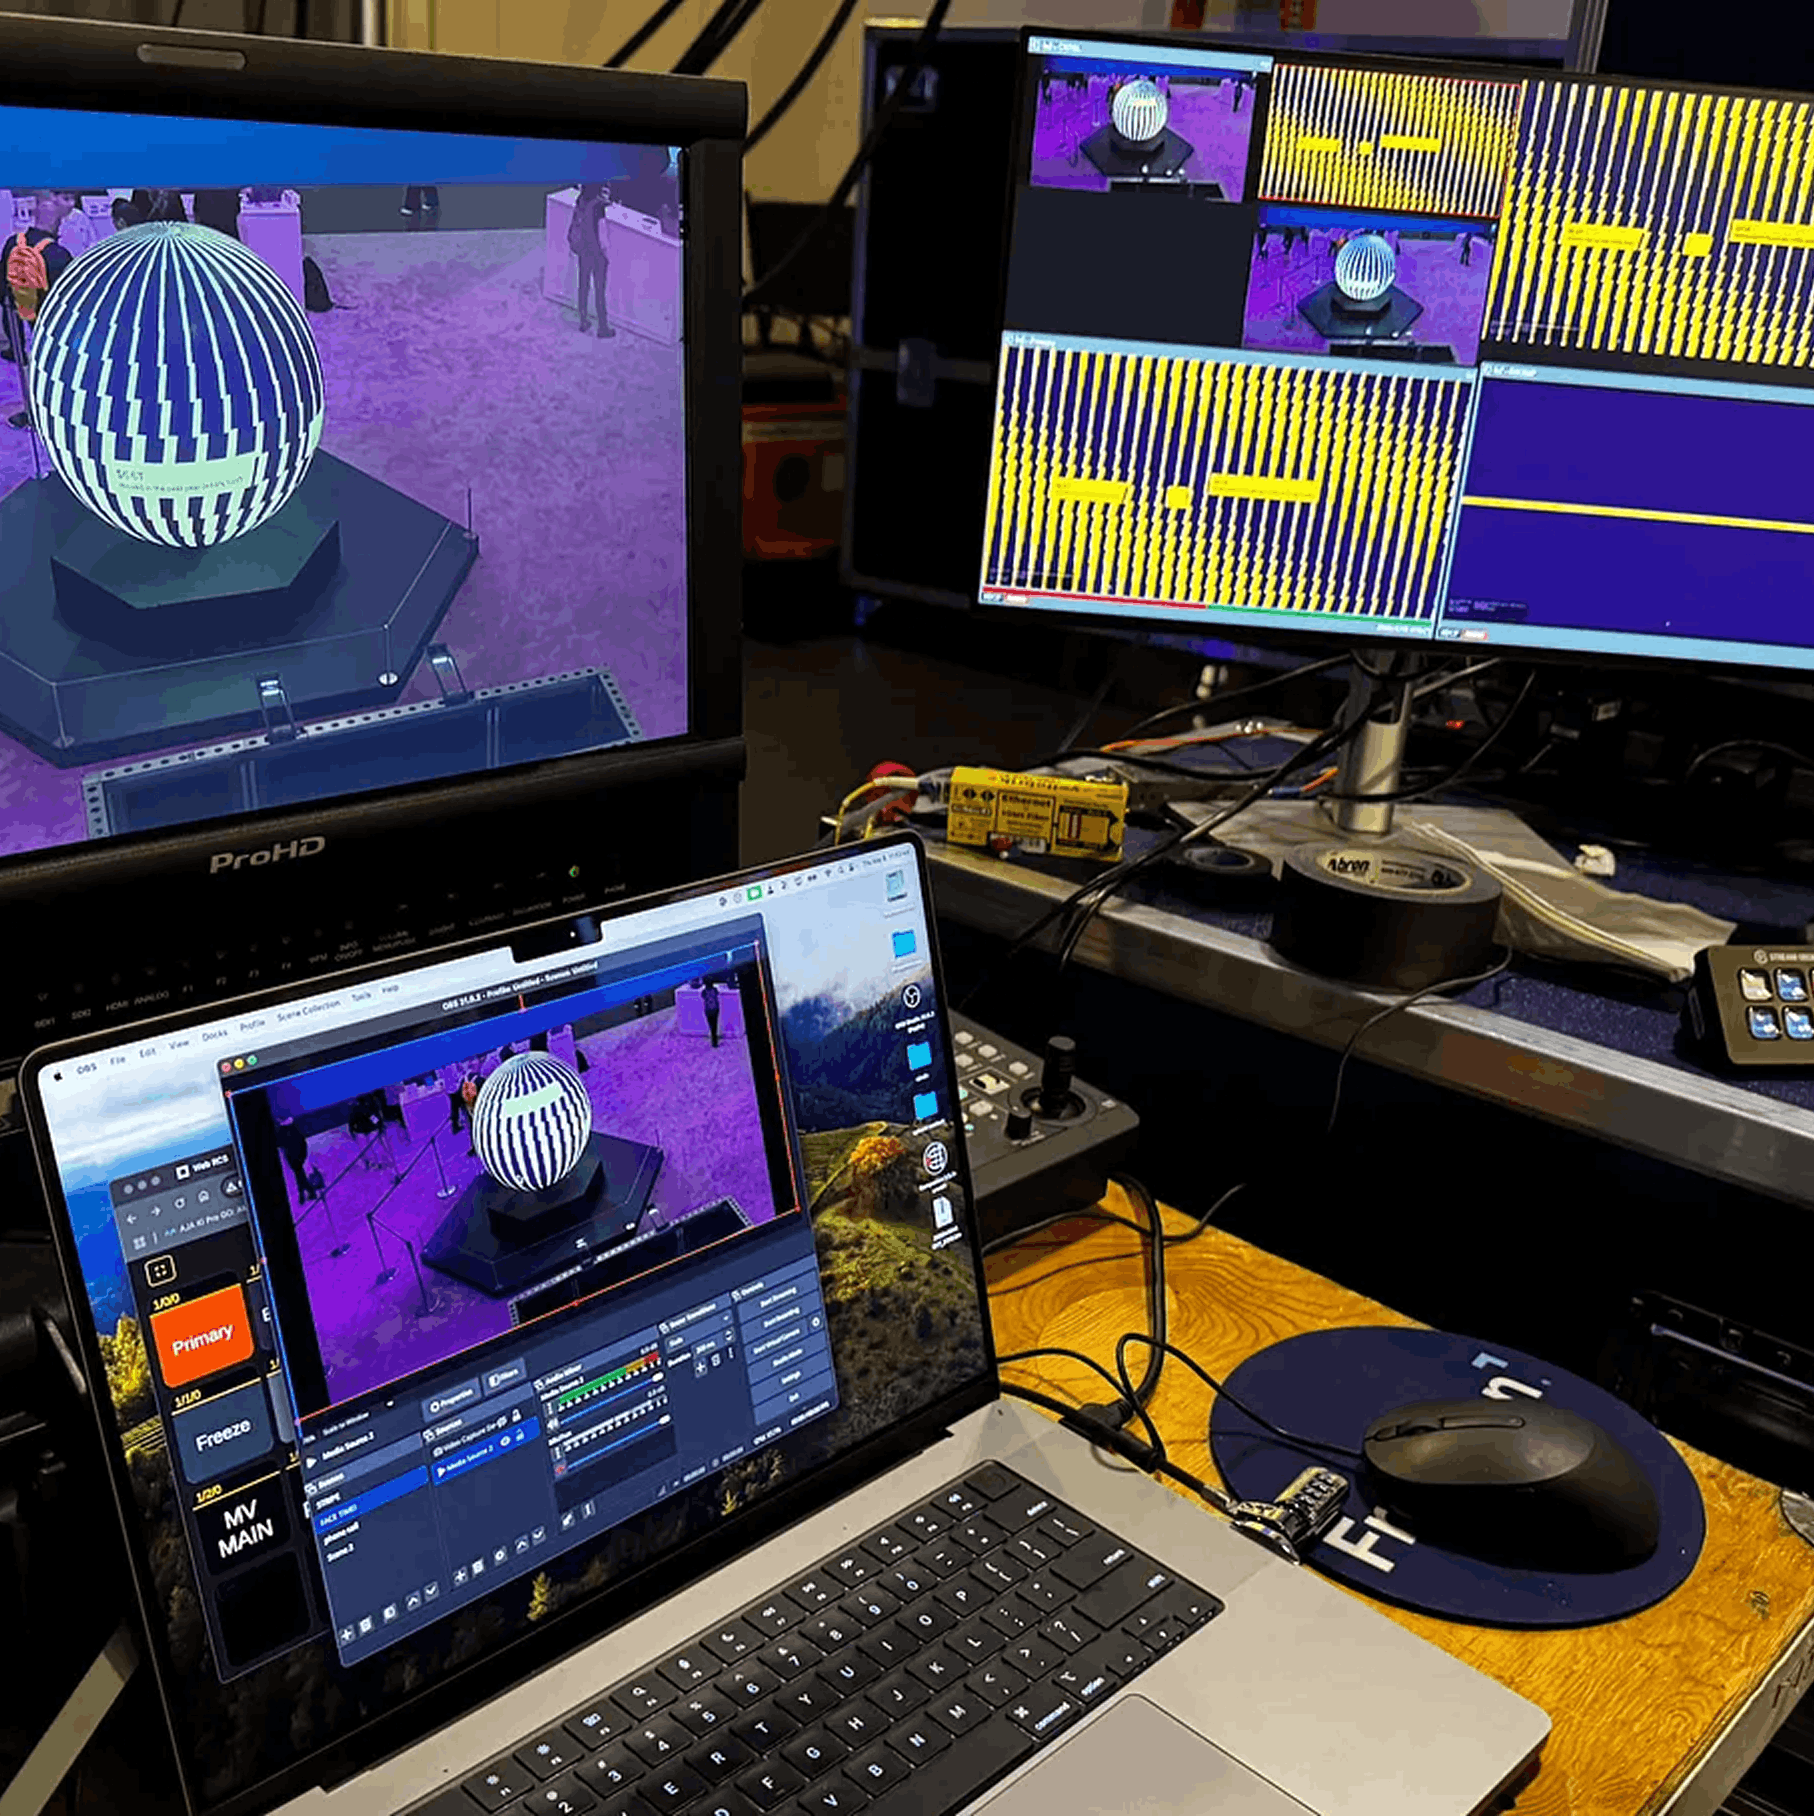
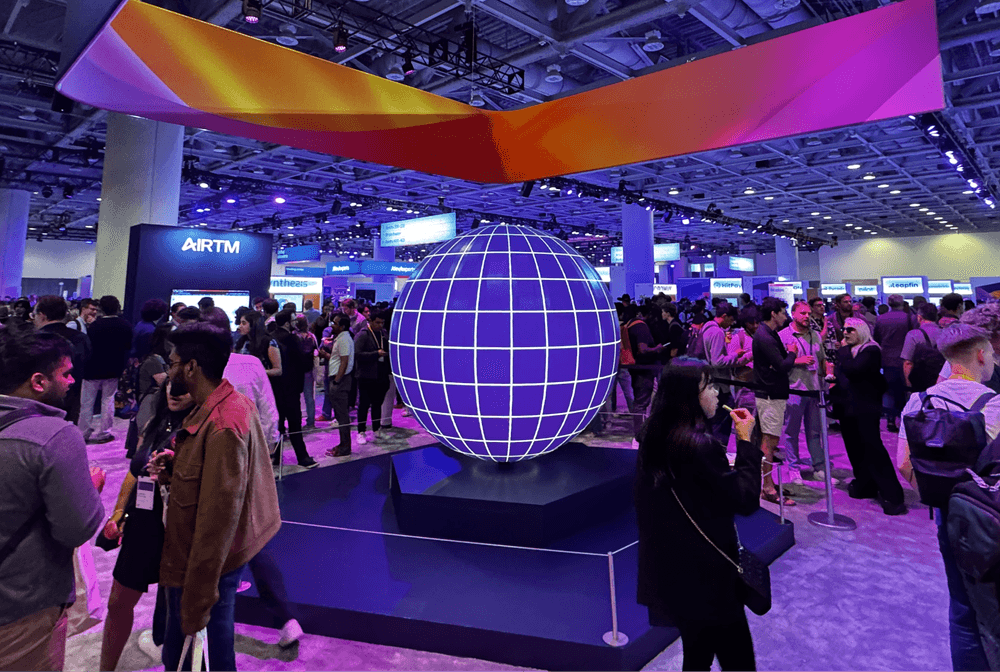
Real-time Crypto Data Visualized on a LED Sphere
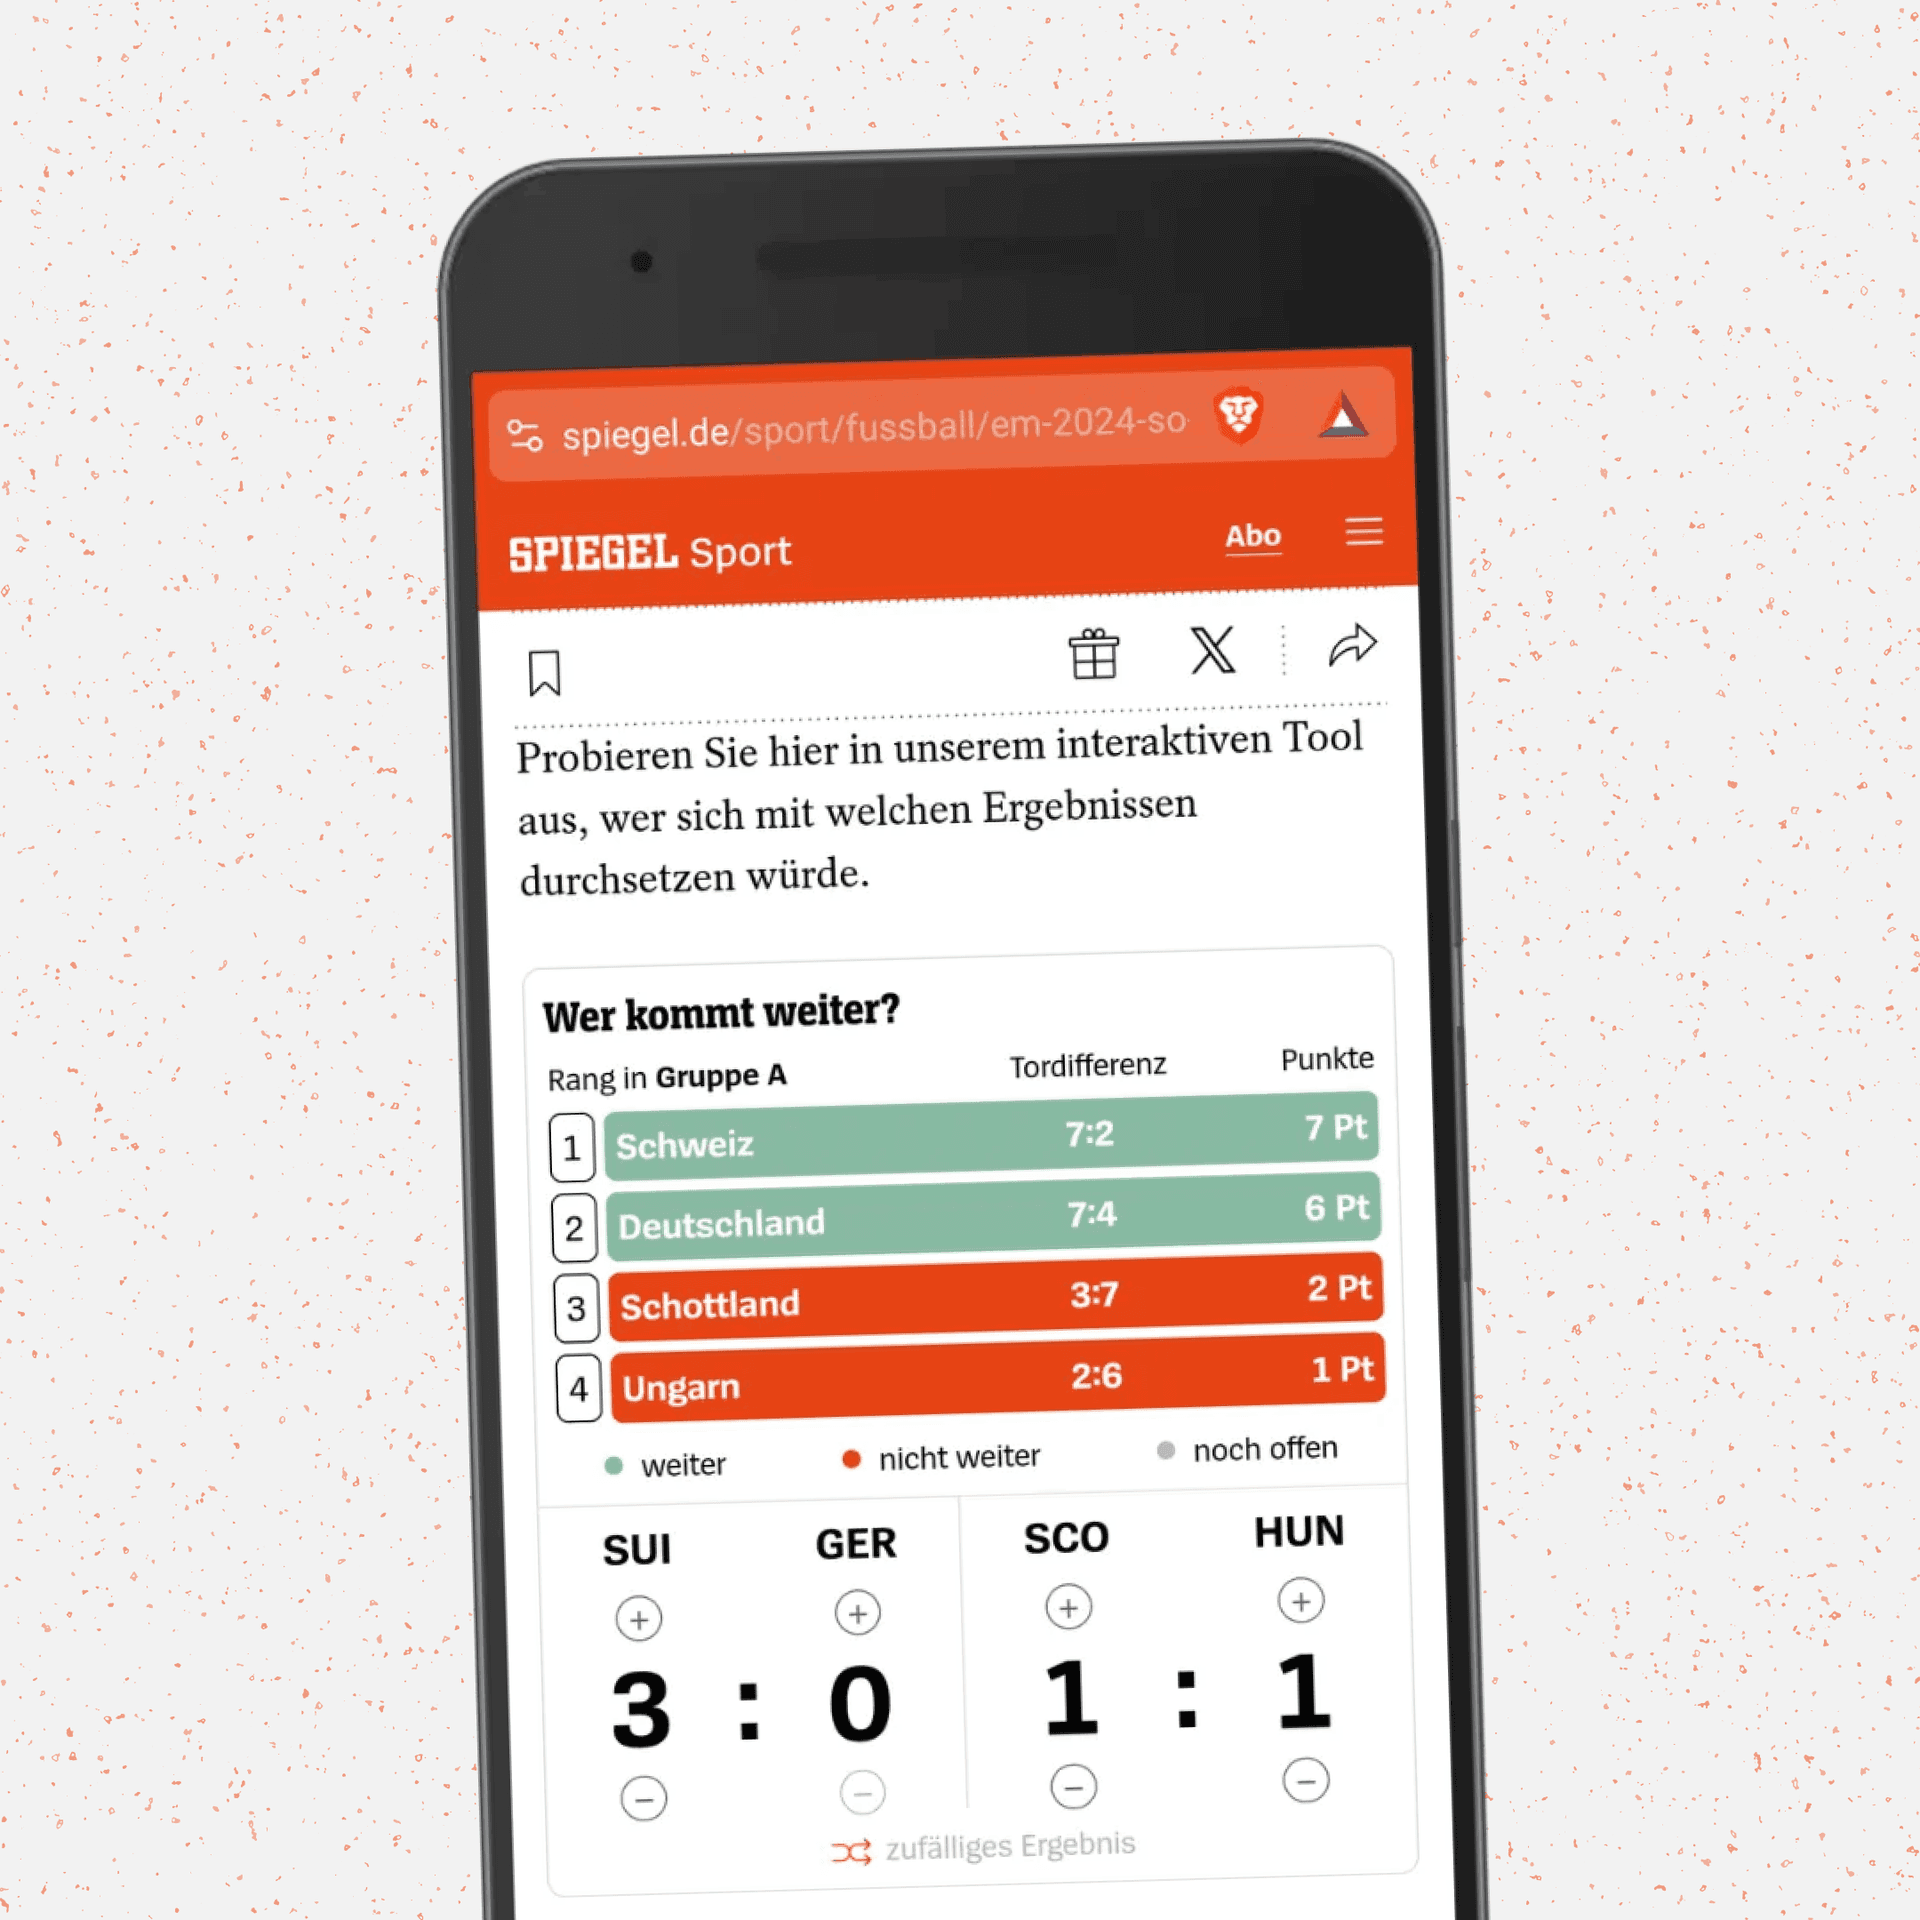
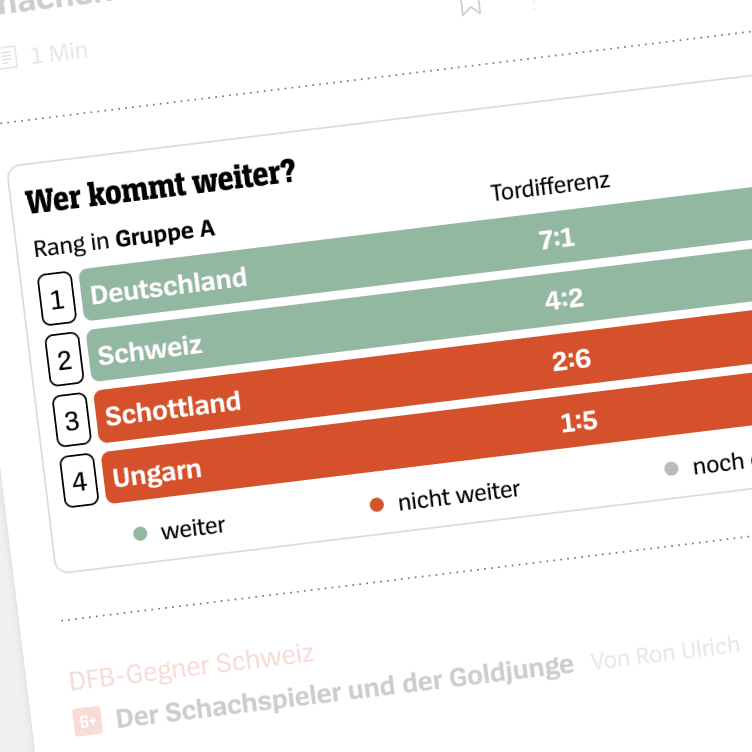
Interactive Ranking Widget for the European Football Championship
Services I offer
Your data, uniquely visualized
I help to transform your initial challenge and raw data into a tailored solution:
Standalone Interactive Visualizations
Highlight your data in a single, interactive piece seamlessly integrated into your existing tech stack — perfect for websites, campaigns, or reports.
Interactive Web-Based Reports
Transform static reports into engaging, interactive experiences that make your data easy to explore and understand.
Data Storytelling
Turn complex datasets into compelling narratives that inform, inspire, and engage your audience.
Data Art
Blend creativity and technology to create visually stunning data-driven art that captivates and intrigues.
Physical Data Experiences
Make data tangible through interactive, real-world installations that spark curiosity and engagement.
Mentoring & Speaking
Gain valuable insights and skills in coding and data visualization through personalized mentoring or engaging talks.
How I work
Tailored for your team
I collaborate with agencies as a specialist you can rely on, or partner directly with organizations to deliver complete data visualization projects. My role flexes to match your team's needs.
For Agencies & Studios
Plug me into your team when you are in need of a dedicated data viz developer.
- I integrate smoothly into your workflow as a specialist you can count on
- I build custom interactive visualizations — frontend, backend, and technical consulting included
- I deliver complex, data-driven projects reliably without handholding
For Organizations & Companies
Partner with me as your data viz specialist to bring your data to life.
- I develop custom interactive visualizations tailored to your data and goals
- I can lead your project from first concept through launch in a full-service approach
- I ensure a reliable, well-communicated workflow throughout the whole project.
About me
Your partner at the intersection of code, design and data
From concept to launch, I combine development expertise with a deep understanding of data and design to deliver projects that transform numbers into interactive experiences people remember.
Here’s what I bring to every project:
Expert coding of bespoke designs
Code that actually solves problems & realizes extraordinary design visions (esp. in D3.js, React, Svelte, p5.js, Three.js)
Extensive project experience
From small non-profits to large organizations, I know the realities of projects—what works, what to watch out for, and how to deliver results.
Reliable collaboration
More than 88% of agencies rehire me for repeated projects thanks to clear communication and consistent high quality work

Kristin Baumann
Happy clients, happy life
“Kristin is everything you would want in a data visualization & frontend developer — her execution is excellent down to the last design details. Throughout our time collaborating on the OpenSecrets frontend web development project, she worked very efficiently, sharing clear and regular updates and problem solving creatively when code or UI challenges arose. She is communicative, dedicated, and an overall pleasure to work with.
Kristin is the kind of freelancer that you bring on to a project and never worry that the work will be delivered, and in great form.
Highly recommend her work and services!”
Marisa Ruiz Asari
Creative Director @ Data Culture Studio

“Working with Kristin is pure pleasure! We've collaborated with her for multiple projects at Parabole Studio and the result was always impeccable. She creates pixel-perfect charts and maps with smooth interactions.
On top of that, Kristin is very organised and communicates progress clearly every step of the way. Strongly recommend!“
Evelina Parrou
Founder & Creative Director @ Parabole Studio
”Kristin ist einfach richtig, richtig gut!
[...] Als Developerin für Datenvisualisierung und Frontend rockt sie jedes Projekt – egal, was ich oder die Kund:innen sich ausdenken, sie setzt es um. [...] Sie ist unfassbar verlässlich, denkt strukturiert, bleibt immer freundlich und respektvoll – und hat immer den Weitblick, Dinge auch mal kritisch zu hinterfragen. [...]
Kurz gesagt: Wer eine Entwicklerin sucht, die nicht nur liefert, sondern dabei auch noch Spaß macht – hier ist sie. Absolute Empfehlung!”
Alice Landsiedel
Agentur für Branding- und Informationsdesign

”[...] Whenever I have a challenging project that needs to be done right, Kristin is who I turn to. She has an rare combination of technical expertise and design sensibility that makes her invaluable. She's tackled everything from high-profile projects for Google [...]
What sets Kristin apart is her incredible attention to detail and her ability to adapt to even the most unusual requirements. [...] She has a great sense of design and truly understands how to make data tell a story visually, all while maintaining her engineering precision.
Beyond her technical skills, Kristin is simply a pleasure to work with. [...] I can't recommend her highly enough.”
Wesley Grubbs
Pitch Interactive

”I worked with Kristin on an interactive web app to present the research agenda of the Kiel Science Communication Network to an expert audience. She consistently improved on our initial ideas [...].
Working with Kristin was a pleasure: communication was always efficient, she was well organized, highly reliable, and delivered on time despite a tight schedule.
[...] I highly recommend Kristin to any team looking for someone who combines strong coding skills with a clear sense for design and usability.”
Björn Döge
Information Designer @ KielSCN

Full versions of the original testimonials can be found in the Recommendations section of my LinkedIn profile.

Have a project in mind?
Let’s bring your data to life with interactive visualizations.